Microsoft Clarity Heatmaps: How to Analyze and Optimize User Behavior

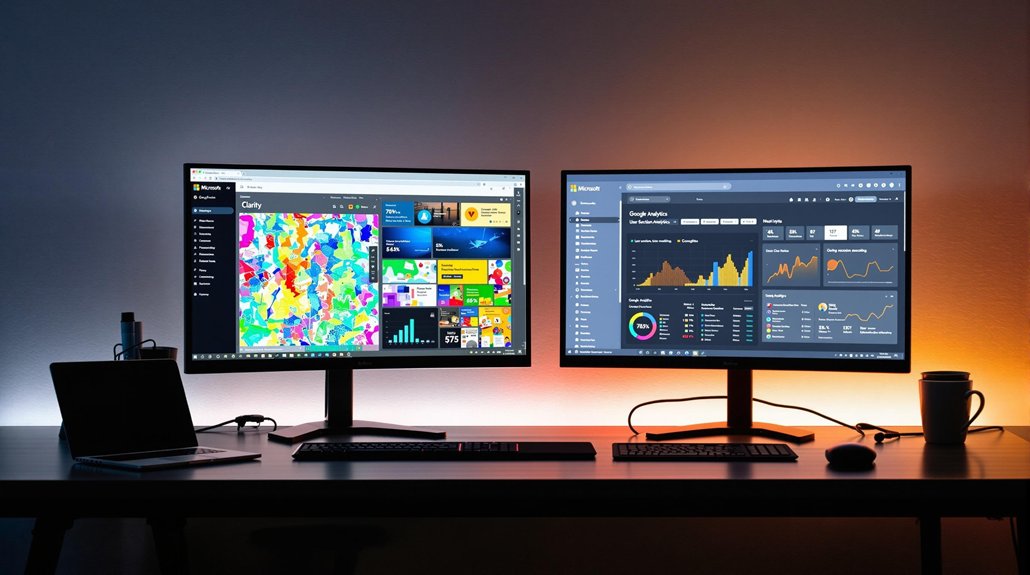
Understanding how users interact with your website is crucial for improving their experience and achieving your business goals. Microsoft Clarity Heatmaps provide a visual representation of user behavior, showing where visitors click, how far they scroll, and which areas of your site capture the most attention.
Best of all, Clarity is completely free, making it accessible for businesses of all sizes. Let’s dive into the features of Clarity Heatmaps and how you can use them to optimize your website.
Understanding the Different Types of Heatmaps
Heatmaps are visual tools that display user interactions on your website. These heatmaps—Scroll, Click, Area, and Conversion—help you analyze user behavior effectively. Click heatmaps provide a vivid picture of user engagement through color coding, revealing patterns like dead clicks and rage clicks, which highlight user frustration.
Area heatmaps aggregate click data for specific sections, allowing you to evaluate click-through rates (CTR) and the effectiveness of call-to-action (CTA) placements.
Conversion heatmaps, tailored for Shopify, track session percentages leading to purchases, pinpointing content that drives conversions. Incorporating real-time feedback tools into your analysis can enhance your understanding of user behavior, providing immediate insights that allow you to refine your website for better engagement.
By using these tools, you can optimize your website based on actionable insights into user behavior, enhancing general engagement.
Leveraging Scroll Heatmaps for Enhanced Engagement
Ever wondered how far users scroll down your webpage before losing interest? Scroll heatmaps are invaluable for analyzing user behavior and enhancing engagement. They show where users drop off, allowing you to strategically place significant content where it gets the most visibility. By optimizing content placement above the average fold, you guarantee vital information isn't overlooked, elevating user interactions.
Regularly reviewing these heatmaps helps identify trends in how users engage with your site, informing decisions for improved website design. With this data, you can continually refine your content strategy to keep users engaged longer. The insights gained from scroll heatmaps are fundamental for guaranteeing your website's design aligns with user expectations and amplifies the impact of your key messages.
Additionally, using tools like WordPress Customizer allows you to make site-wide changes that enhance user experience without needing to code.
Improving User Experience With Click Heatmaps
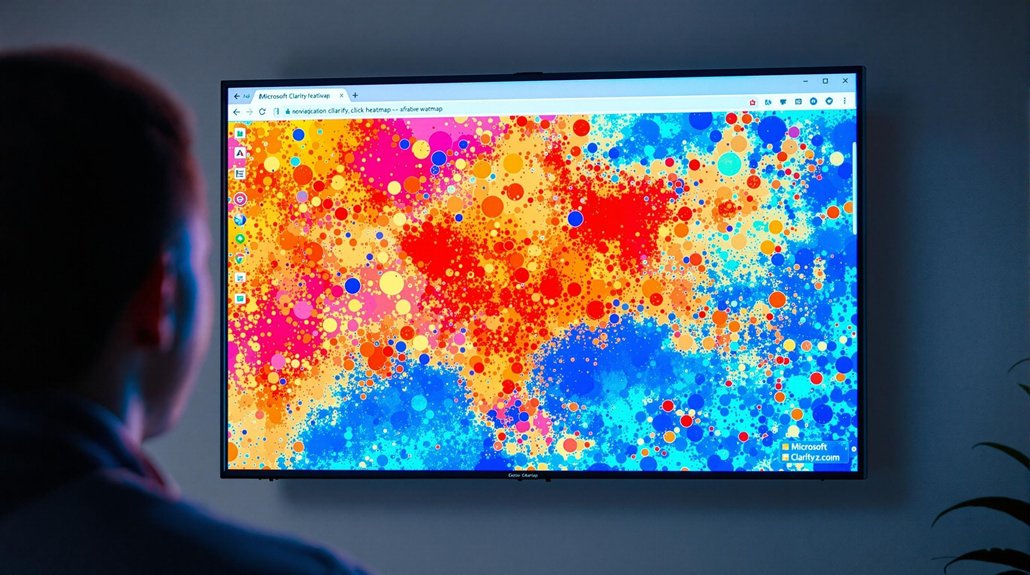
Click heatmaps are vital tools for enhancing user experience by visually representing user engagement across your webpage. They highlight where users click most, using red for high-traffic areas and blue for low-traffic ones. By leveraging user behavior analytics, you can identify dead clicks on non-interactive elements, streamlining site navigation and minimizing frustration.
Rage clicks often indicate dissatisfaction due to poor design or slow load times, prompting necessary improvements. Use click heatmaps for A/B testing to pinpoint which CTAs or layouts elevate user engagement and conversion rates. Understanding click distribution helps make strategic decisions on CTA placement, enhancing user experience and driving conversions.
These insights guarantee your site effectively meets user needs and expectations, fostering a seamless interaction. Regular maintenance and updates are crucial for ensuring optimal performance and security, which in turn enhance user experience.
Optimizing Layouts Using Area Heatmaps
Area heatmaps are powerful tools for optimizing webpage layouts by highlighting where users are most engaged. Using Microsoft Clarity, you can analyze user behavior and see where clicks concentrate on your site. This allows you to optimize layouts by strategically placing calls to action (CTAs) in high-engagement areas, increasing user interaction and driving conversions. By identifying sections that attract the most attention, you can refine your webpage to improve the visibility and order of CTAs.
Area heatmaps also reveal underperforming areas, prompting necessary changes to enhance user engagement. Regularly reviewing these insights guarantees that your content remains accessible and engaging, leading to continuous improvements in layout design and better outcomes for your website's goals.
Boosting Conversion Rates With Conversion Heatmaps

Conversion heatmaps are essential tools for improving your website's conversion rates, especially if you run a Shopify store. By using Microsoft Clarity, you gain insights into user behavior that can optimize your site's performance.
Analyze conversion heatmaps to identify content that effectively drives conversions, allowing for targeted adjustments in product placements. This strategic approach can notably increase user engagement and purchase decisions. Testing new images or repositioning underperforming products based on this data helps concentrate your efforts on high-impact areas.
Focusing on these insights enhances your website's performance, leading to higher conversion rates. By prioritizing content that truly drives sales, you improve your marketing efforts' ROI. Ultimately, conversion heatmaps guide you in making informed changes that uplift your online store's success.
Utilizing Predictive Heatmaps for Future Insights
Leveraging predictive heatmaps, you can gain foresight into user interactions on your website, enhancing your ability to make data-driven design decisions. With Microsoft Clarity, predictive heatmaps utilize AI to analyze historical data patterns, forecasting user behavior such as clicks and scrolls. This offers insights that allow you to improve conversion rates by proactively identifying potential hotspots and cold spots.
- Design adjustments: Modify elements before users interact, enhancing effectiveness.
- Content placement: Strategically position call-to-action elements to elevate engagement.
- User experience: Tailor site layout to anticipated user interactions, increasing satisfaction.
Clarity makes it easy to share heatmaps with your team or clients. You can create public links or download heatmaps for reporting and archiving. This feature ensures everyone involved in your website’s development is on the same page, making collaboration more efficient.
Businesses across industries have used Microsoft Clarity to improve their websites. For example, a content publisher used heatmaps to identify underperforming articles and repositioned them on their homepage, resulting in a 25% increase in page views. Similarly, an e-commerce site optimized its checkout process based on heatmap data, reducing cart abandonment rates by 18%.
Conclusion
Microsoft Clarity Heatmaps are a powerful tool for analyzing and optimizing user behavior on your website. By leveraging click, scroll, and area heatmaps, you can gain valuable insights into how visitors interact with your site and make data-driven improvements.